What Is the Average PPC Conversion Rate? (Updated)
Written by 

As marketers, we love to make data-driven decisions. We monitor our analytics, perform tests, and measure the results. However, getting caught up in tiny bubbles is very easy. When all the data you're monitoring and comparing is yours, you start to miss the bigger picture.
Let's talk about conversion rates.
A conversion is generally a user turning into a customer via making a purchase or subscribing. Conversion rates, then, are the percentage of your total users who convert in a given time. There's a lot of nuance to this and different ways to calculate it.
- Conversion rates per channel. What percentage of people arriving from Facebook convert, versus people from Google search, versus people from PPC ads, and so on?
- Conversion rates per media type. Text ads versus display ads versus your blog, etc.
- Conversion rates in paid versus organic SEO channels.
These are just some of the data points you can monitor and compare.
The thing is, while you can harvest plenty of data about your landing pages, you can't gather any from your competitors, others in the industry, and others online (except rough estimates). It's all data that is unique to you, after all. And yet, we wonder, how do we compare to everyone else?
After all, if you're pushing and pushing, and you can't seem to increase your conversion rate or CTR (click-through rate) any further, it can be disheartening. But, if you realize that you're way ahead of the industry average, maybe that will make you feel better. More importantly, perhaps it will make you dial back the CRO (conversion rate optimization) efforts and start spending your time and effort elsewhere, like on traffic generation or R&D.
So what is the average PPC conversion rate?
The Simple Answer
If you search for this question, you're likely to see one specific number.
"The Average PPC Campaign Conversion Rate is about 3.75%."
It's such a prominent number that it's even part of Google's knowledge graph, pulled out and given prominence on the search results page.
Problem 1: It's a bit old.
The first problem you might spot is that all websites citing this statistic discuss 2020 averages. It's 2022 now; we should at least look at data from 2021.
Well, alright, this isn't that much of a problem. Data changes yearly, but it doesn't change much, so this figure is still relatively accurate.
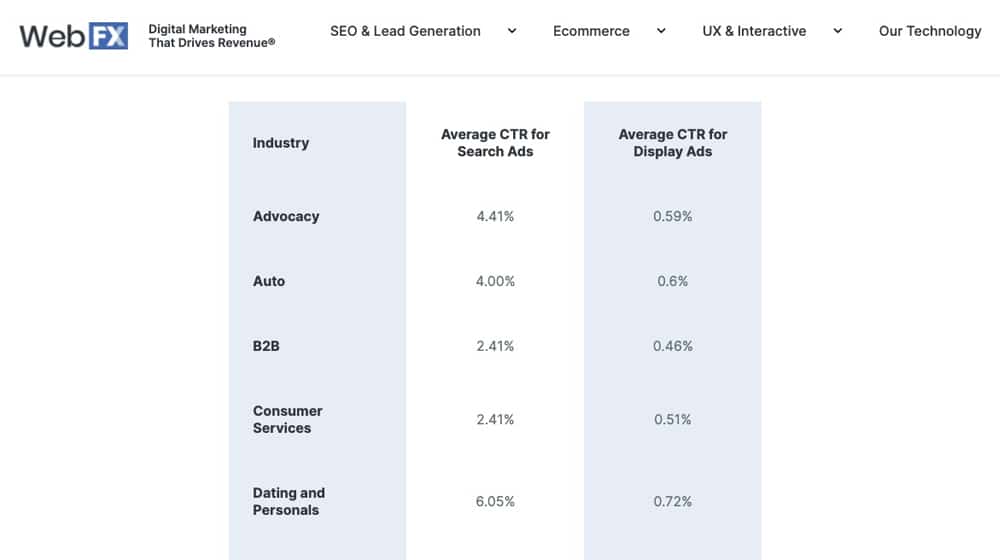
If you do a little digging past the data Google decides to promote for you, you can find slightly more updated figures. For example, WebFX says that the average conversion rate for PPC (or at least, for Google ads PPC) is 3.17%. A little slower, but still in the same ballpark.
Problem 2: It's a cross-industry average.
The biggest problem with this figure – both the older and the newer one – is a platform average. It's the average of all paid search ads run on the platform, which, in this case, is generally just Google Ads. Other ad platforms may have better or worse performance. Even Google Display Network is much lower, at a meager 0.46% average.
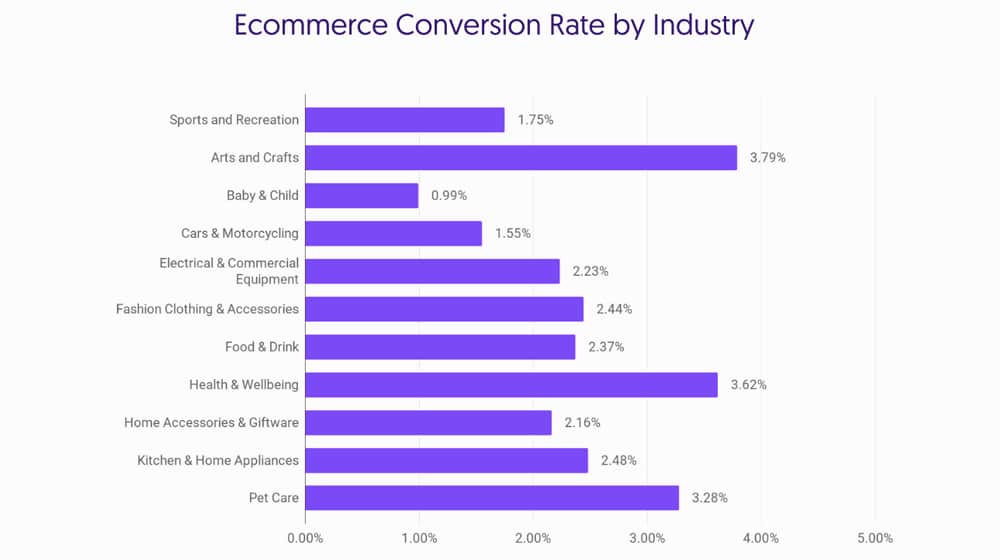
The thing is, your conversion rate will have a different kind of benchmark. Every industry has its averages. If you're a shoe store, would you be comparing yourself to a car dealership, a nonprofit, and a dating site for conversions? Of course not. You'd be comparing yourself to other shoe stores or at most other apparel stores.
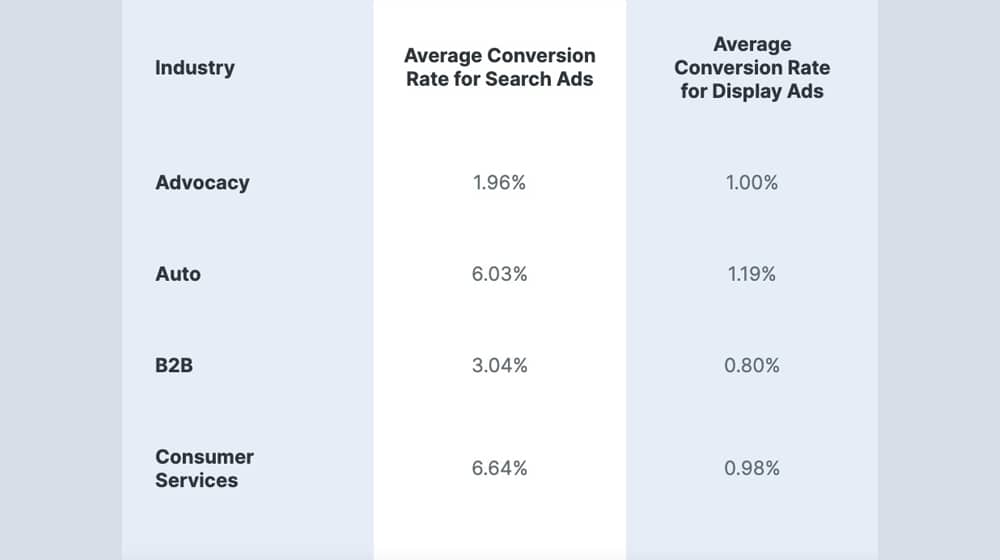
Here are some narrower figures, again taken from WebFX:
- Advocacy: 1.96%
- Auto: 6.03%
- B2B: 3.04%
- Dating: 9.64%
- Education: 3.39%
- Finance: 5.10%
- Legal: 6.98%
- Real Estate: 2.47%
- Travel: 3.55%
This information isn't all of the data they harvested (you can see the full chart on their page here), but it gives you an idea of how broadly varied the PPC conversion rates can be.
And, again, these are all figures specifically for Google search ads. Display ads through Google's display network are much worse. Remarketing/retargeting ads may have even higher conversion rates.
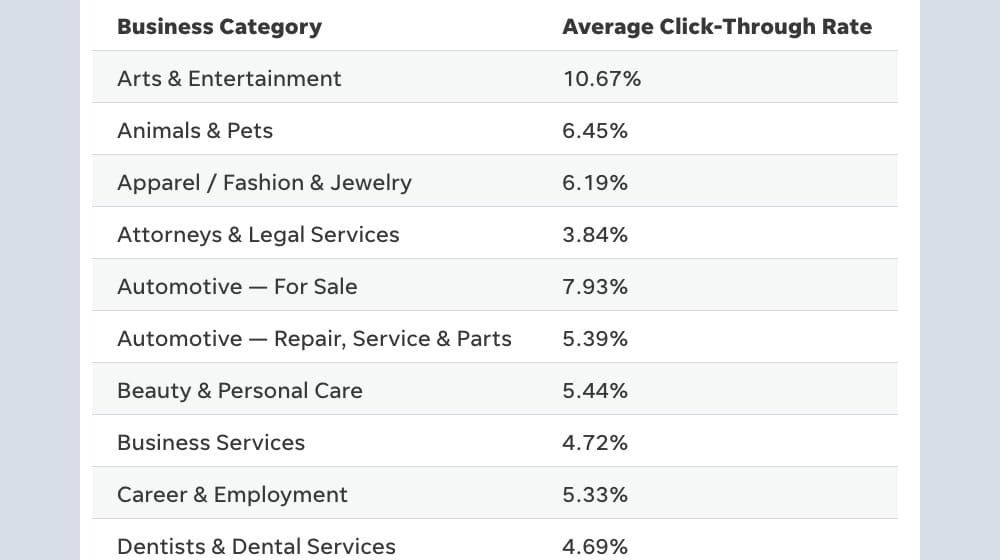
Another source of data is Wordstream, which manages a lot of the PPC advertising for businesses.
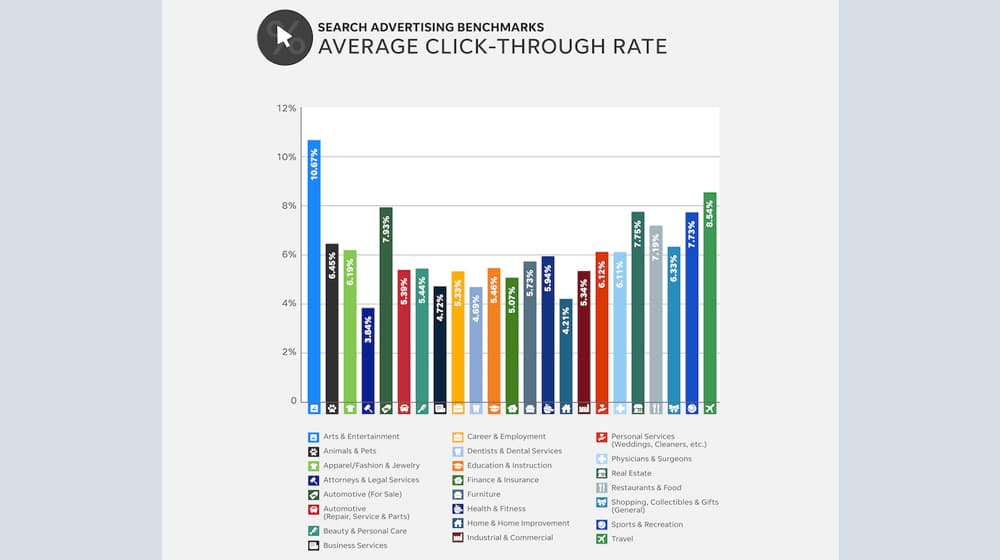
They've published their 2021 data here.
- Arts & Entertainment: 5.90%
- Pets: 19.19%
- Legal: 11.54%
- Auto: 6.57%
- Dental: 13.81%
- Furniture: 3.25%
- Travel: 6.01%
And so on. You can see that this is all over the map as well. Some industries have astonishingly high conversion rates, while others are low.
Of course, this data also has a flaw, which is that it's from customers of an advertising agency.
- People using an advertising agency can be assumed to at least have some idea of what they're doing or if they're letting the agency manage their ads for them, that the agency knows what they're doing. The numbers can be inflated compared to an actual industry average.
- Conversely, some industries may have lower numbers. Somebody playing with Google Adwords (now Google Ads) or Facebook Ads for the first time is more likely to have a higher average cost and call per action than an agency. Their quality score might be lower, they might not use negative keywords, only use a few search terms, or their audience targeting may not be as narrow. Your average art supply store may not enlist the help of skilled agencies as often as your average law firm. All of these things can bring down the industry average.
- There's also the type of business. An e-commerce store or a software business with a free trial will have a higher conversion rate than something like a high-priced agency or a company selling building materials. A low conversion rate on these things isn't necessarily alarming, especially considering the average value.-
- Lastly, there's the campaign type. Is the website running basic CPC (cost per click) ads? Search network ads? CPA (cost per action) ads? How many ad placements do they have? Are they doing remarketing too? These variables make these averages far less helpful as these businesses are running different ad types.
Even if there were, it would be a biased sample of people who provide that data.
Problem 3: It's still low.
The average conversion rate still includes all businesses that pay for ads, despite not knowing what they're doing. It consists of people mainly getting outbid, companies with poor reputations, and on and on. It includes companies operating outside the U.S., globally, or in other countries. The average is dragged down by a lot of data that isn't necessarily meaningful.
A reasonable PPC conversion rate is higher than 3%. It's higher than 5%.
PopUpSmart estimates that the top 25% of online businesses have a conversion rate of over 10%, and the top 10% of advertisers have a conversion rate of around 11.45%. To be considered one of the best in your industry, you should be aiming for 10%, not 3%.
They also give us a little more data for other channels. Google Ads might have a 3.17% conversion rate on average, but Microsoft has a 2.94% through Bing Ads, and Amazon has a nearly 10% average. Of course, using Amazon as a platform doesn't work for many businesses, so it's not very relevant to you.
So What's The Average Conversion Rate?
With all of that said, you're probably still looking for a number:
This number is an average across all industries, so your industry may vary. Still, this may be helpful for you to understand how close you are to the norm. Suppose you're in an industry with a higher-than-average conversion rate compared with other sectors (or lower than average). In that case, you may want to look up the stats on your particular industry and compare your conversion rate against the average.
Comparing Data is a Fool's Errand
Above, I warned against falling victim to not seeing the forest through the trees. You spend so much time looking at your data that it's hard to tell if that data is good or bad compared to the rest of the industry.
Well, now I'm going to make the opposite point: data for the rest of the industry might not be relevant.
The biggest issue is: where is the data coming from? Every source of information you can find online is either skewed or biased.
- Data from Wordstream comes from LOCALiQ, in a sample of 18,000 customers.
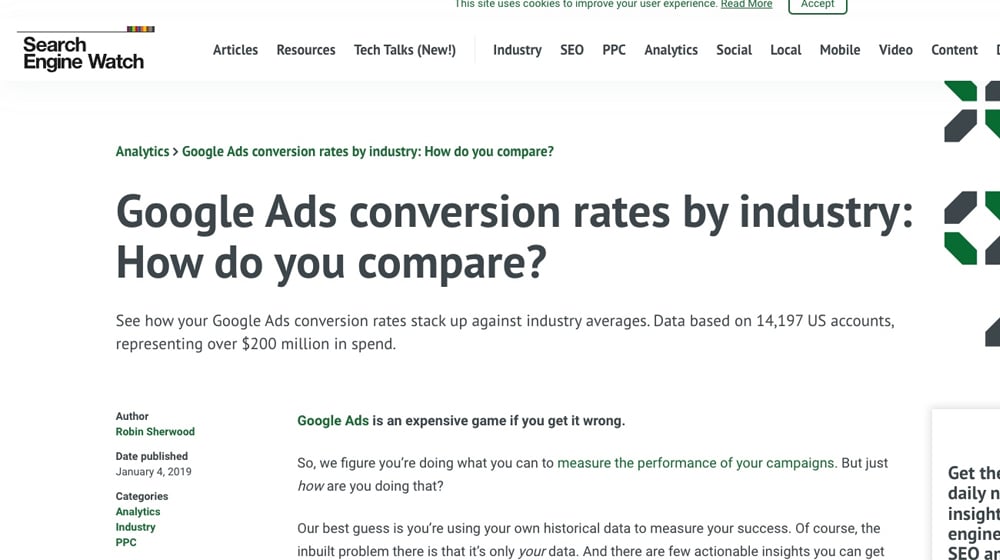
- Data from the WebFX post above comes from SearchEngineWatch, from 2019, and uses a model of 14,000 accounts.
- Plenty of posts written in 2021 cite data from older posts, which may go as far back as 2016!
While this data can show you a broad, general range for your industry and your chosen platform, it's still difficult to compare down to the decimals. If a benchmark claims that your industry conversion rate is 4.73%, I would say that means anywhere from 3.5% to 5%, and you should treat it accordingly.
Use data for estimates and general benchmarks. If your conversion rate is 5% and the industry average according to all of these different posts is 7%, maybe you have some work to do. If yours is 5% and they claim the standard for your industry is 3.5%, I wouldn't worry about trying to squeeze out that additional 0.5% when you've already done all that you can to optimize and split test your ads.
How to Use Benchmarking Data
With all of the problems these sorts of benchmarks have, it's clear that many people don't know how to use them. So, here's my mini-guide.
Step 1: Find the most recent, representative data you can.
As much as I talk about bias, reports from Wordstream and other significant figures in the industry are the best you're going. That is, at least until Google (or Microsoft, or Facebook, or whatever other networks you might use) decide to spill the beans on its comprehensive real-world data.
So, the first thing to do is find the best sources you can. You want them to be as narrowly focused on your industry as possible, and you want them to be as up-to-date as possible. Ideally, it will also be representative data over at least six months, if not a full year.
Step 2: Understand what the data is referencing.
A "conversion rate" can have a lot of different meanings. For example, for the Wordstream data, it's search engine PPC "across all search engines Here's." what they say about it:
"This report is based on a sample of 18,316 North American-based LOCALiQ client campaigns in the outlined business categories that were running search advertising across all search engines between May 1, 2020, and June 25, 2021. Each business category includes a minimum of 69 unique active client campaigns. "Averages" are technically median figures to account for outliers. All currency values are posted in USD." – Wordstream
The important part is not necessarily to find the most accurate data for your situation but to know the data's situation. That's because your goal is to pick your information that matches these parameters as closely as possible.
For example, if you're a non-North American business, this data isn't relevant to you. If your data comes from a different date range, this data isn't relevant to you. If you only run ads on Google and other search engines, this data won't be suitable.
Find a source of data that matches yours as closely as possible, and then find your data that matches the original as closely as possible. Again, though, I mean in terms of parameters, not in terms of results. Don't look up that your industry has a 5% conversion rate and then cherry-pick your data to show you have a 6% rate.
Step 3: Decide.
Once you have the most accurate comparison you can find, figure out where you stand.
Generally, you can find yourself in one of four categories.
- You score very sub-par. If your conversion rate is far below the data, you have some serious work to do.
- You score slightly sub-par. If your data is lower, but not by much, there may be confounding variables that mean you're still doing fine. You can still work on improving, but it might not be as much of a priority.
- You score average or slightly above. If you're right around where the industry averages claim is the "average," you're doing fine. You can keep trying to improve, but chances are you'll get a better return on your investment if you work on other aspects of your business instead.
- Your score is above average. Suppose you're somewhat above the industry benchmark; great! Keep it up, and turn the majority of your efforts to other factors.
What other factors can you turn to?
- Try increasing your average cart value. High conversion rates are great, but it's not great if your average order value is low compared to the industry average.
- Try increasing your volume. You can have a 50% conversion rate, but you're still underperforming if you only had two visitors.
- Try improving your customer satisfaction. Your CVR only tell one part of the story, after all.
- Try improving your CTAs. If your pages have several layers of friction, try removing them. For example, it's effortless to buy something on Amazon - checkout friction results in a drop in sales. Try making your order pages clear and concise, and make them as easy to order as possible. Take advantage of single-page checkout systems, one-click upsells, and guest checkouts. If a user has to create an account before buying something, that's added friction, and you'll notice a slight drop in sales.
- Try A/B testing. Your ads may seem adequate at first glance, but how do you know you're not overspending? Have you created many ad variations? You won't know if a change is an improvement or a detriment until you try it.
There are many different paths to business success. You can't spend all of your time and energy optimizing just one or two of them to increase conversions; you need a holistic picture of your business. Only then can you analyze how you're performing from every angle and find weaknesses in your marketing strategy that you can work to improve.
Written by James Parsons
Hi, I'm James Parsons! I founded Content Powered, a content marketing agency where I partner with businesses to help them grow through strategic content. With nearly twenty years of SEO and content marketing experience, I've had the joy of helping companies connect with their audiences in meaningful ways. I started my journey by building and growing several successful eCommerce companies solely through content marketing, and I love to share what I've learned along the way. You'll find my thoughts and insights in publications like Search Engine Watch, Search Engine Journal, Forbes, Entrepreneur, and Inc, among others. I've been fortunate to work with wonderful clients ranging from growing businesses to Fortune 500 companies like eBay and Expedia, and helping them shape their content strategies. My focus is on creating optimized content that resonates and converts. I'd love to connect – the best way to contact me is by scheduling a call or by email.


Comments