How to Track Sales from Your Blog Posts in Google Analytics
Written by ![]()
Do you know how well your blog is working?
Knowing, in tangible terms, how your blog is performing is a critical component to blogging success. Without tracking data, you don't have metrics to compare as you optimize.
A lot of companies I've seen go into blogging without a real goal in mind. They know that a blog can help them get sales, but they don't really understand how. They set about blogging, but they don't track what they're doing. They rely on overall numbers like website traffic and overall sales.
The goal of any marketing effort is, of course, sales. If you do it well, sales go up. If you do it poorly, sales don't go up, or even go down if you botched your messaging in some way.
But can you answer these questions?
- How many new sales came from blog readers, versus other website visitors?
- What is the conversion rate for your blog in general?
- How has your blog conversion rate changed over time?
- What is your blog's return on investment?
Answering questions like these with tangible numbers and hard data is hugely important. Without data, without the ability to know how your blog is performing, you have no idea how you can improve, or if your efforts are improving your site at all.
Luckily, you can track this kind of data in Google Analytics. You just have to set it up.
Key Takeaways
- Without tracking data, businesses can't measure blog performance, compare metrics, or know if their optimization efforts are working.
- Google Analytics requires a JavaScript tracking code installed on every page you want tracked; it cannot record historical data retroactively.
- Goals in Google Analytics fall into four categories: Destinations, Events, Pages per Session, and Duration.
- Content Groups let larger sites track different content types separately, enabling more granular performance comparisons across categories.
- Key optimization strategies include identifying underperforming content, spotting high-converting channels, calculating ROI, and finding conversion process roadblocks.
Step 1. Configure Google Analytics
If you already have Google Analytics installed on your site, you probably don't need to read this section and can skip to the next step. If you don't have it installed, or you aren't sure, or it's not configured properly, keep on reading.
If you haven't registered for Google Analytics already, you can find it here. You'll need to verify your website as a property in Google's search console (formerly webmaster tools).
Google will give you a piece of tracking code. This tracking code needs to be put into your site HTML. You can find it in the Admin tab of the analytics, which is down at the bottom left of the left-hand pane. From there, in the middle, will be a Property tab. Click on Tracking Code (add your property if you haven't, first), which expands. Then click on Tracking Code again, and Google will expand a window showing you the tracking code itself. It's a short, simple bit of JavaScript.
You need to put this code on every page of your site that you want to be tracked. All blog posts, all landing pages, all category pages, your homepage, everything. Leave it off of system pages that you don't want tracked, as well as hidden pages that your users should never see.
You need to put the code in the right place on your page too. If you put it in the wrong place, it might double-track users, fail to track some visitors, or otherwise track your visitors incorrectly. It can also slightly delay page loads, which can hurt other SEO metrics like page speed and some of the new Core Web Vitals. You can read this guide on placing the code properly.
Something important to note here: Google does not track information from before code was installed. This applies to general website information, and it applies to specific things like event flags. If you've had Analytics installed for years, that's great, but if you add a new event flag on a produce sale, it won't retroactively record all clicks of that link as sales. Data only starts recording moving forward. This is why getting your configuration set up first is so important. If you use Shopify, it's also worth checking whether GA4 is tracking your revenue correctly before relying on your data.
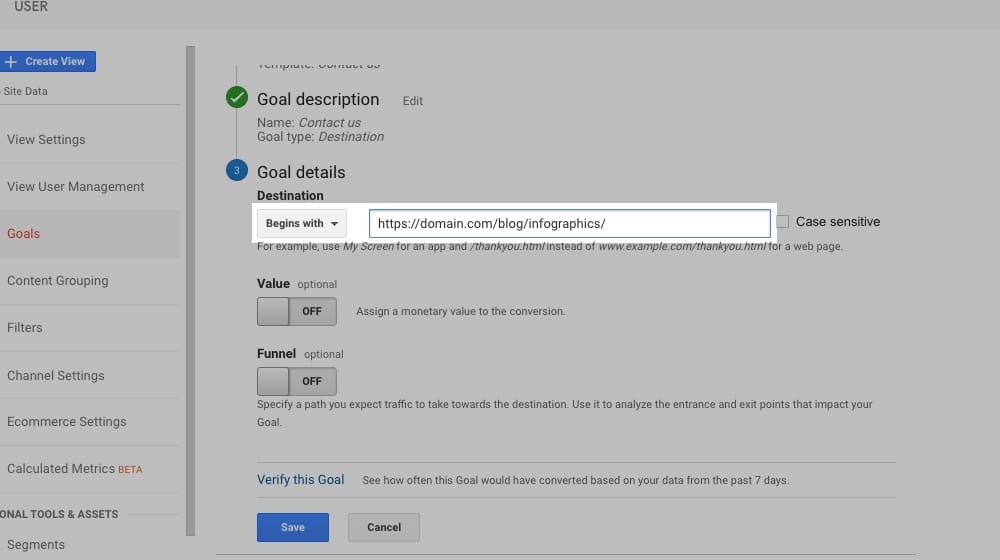
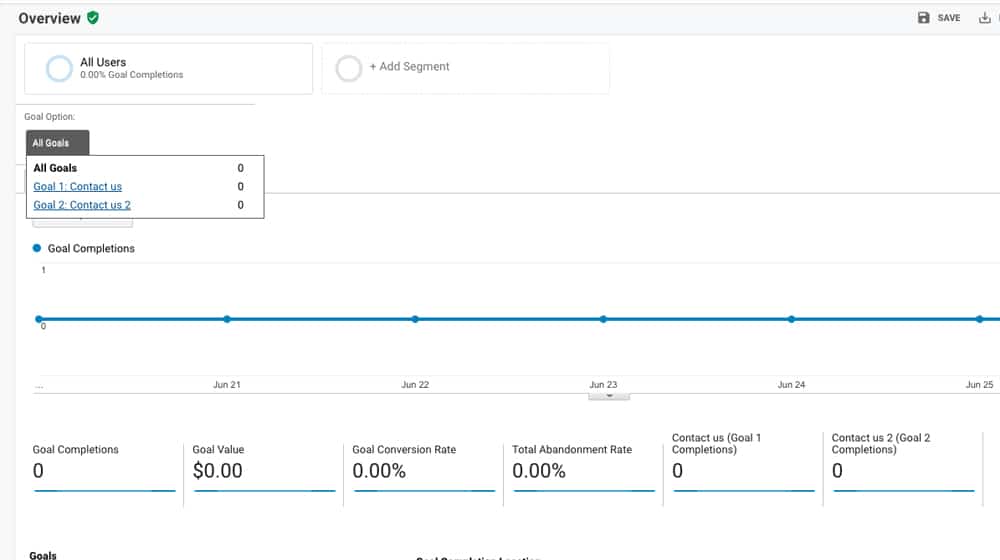
Step 2. Define Your Goals
You'll need to define and set your goals in Google Analytics. Goals, as a concept, are simple. They're the events you want tracked that correspond to specific beneficial things a user can do on your site.
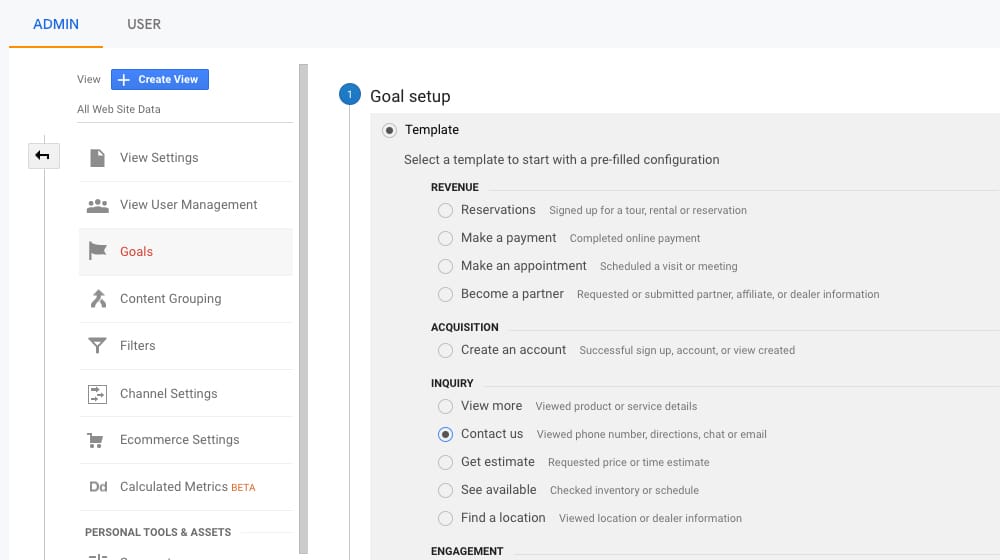
In Google terms, there are four categories for goals:
- Destinations. For example, if a user signs up for your mailing list, reaching the "thank you for signing up" page is a destination you can track. It only loads when a user signs up, so it corresponds 1:1 to new sign-ups from that page/channel.
- Events. For example, clicking on an ad is an event, clicking on a social share button is an event, or clicking play on a video is an event. You can define any custom event you want to track.
- Pages or Screen Per Session. For example, if you don't want to consider someone a user of your site until they've visited three pages on your site, you can set that as a goal, and it will only track the people who meet that criteria.
- Duration. For example, if you want a session to only count if a user has spent at least five minutes on your site, you can set this goal.
Additionally, Google has Smart Goals, which are dynamic goals to track user behavior on your site when you don't have enough conversions to make use of other Google optimization tools. You can read more about that here.
So, this second step is where you need to define what your goals are going to be. What, to you, is important for your blog? Product sales, obviously. Newsletter sign-ups, sure. Registration for a forum or community, okay. Leaving a blog comment, maybe. You have a lot of flexibility because you can define custom goals and attach them to virtually any action a user can take. Think about what you want to get out of your blog, and define goals related to that. If you're unsure which SEO ranking factors matter most, that can also help inform which user actions are worth tracking as goals.
Step 2a. Consider Content Groups
Google has a feature called Content Groups that is optional to use but can be helpful for some sites.
What does it do? It allows you to specify certain kinds of content on your site as a content group, which tracks separately from other content groups. This way, you can see data for your site as a whole, then data for specific content groups individually. For example, you might divide up your site into Infographics, White Papers, Case Studies, and Blog Posts as content groups.
Or, if you don't have all those different kinds of content, you could divide up your blog. Marketing, and Conversion, and Optimization, and Social, or whatever other broad topic categories you use. The more granular you make your content groups, the more granular your data will be.
For the most part, this is only useful for sites with larger and more sprawling blogs. Small sites and small blogs won't have enough content variation for this to really be a worthwhile definition. It's worth exploring if you want, but it's not necessary, hence being a sub-point to Step 2.
Step 3: Configure Google Analytics Reports
Now that you have your data tracking set up, you can start configuring your reports. Reports are the way you see your data, presented in a way that helps you use it. It doesn't do you any good to see raw pageviews but if you see "pageviews per conversion", you have your conversion rate. If you see "conversion rate per page", you can see which pieces of content are getting you the most conversions. If you have pageviews per page, you can compare that with conversions per page, and you can see whether it's always a correlation between popularity and purchases, or if there are two different audiences at work on your site.
There are a ton of different reports, some of which are available by default, and some of which can be put together manually or imported from templates. I'll give you a quick rundown, though you'll want to put some serious thought into what metrics are important to your business and how you want to view them.
Audience Reports. The audience section of Google analytics is where they harvest and store all of the information they can about your users. This is where you'll see demographics like age, gender, language, and location. You'll also be able to see interests and affinities, which can be very useful. Knowing your audience allows you to better tailor your content to them, specifically, rather than just a concept of who you think you're marketing to.
Active Users Reports. This is a kind of audience report, and it gives you an idea about your visitor loyalty. It's a rating of the number of people who keep coming back to your site within a given time period. You want this number to be high because it means people keep coming back to your site, rather than visiting once and never returning.
Customer Lifetime Value. This report only works with data harvested after you've started tracking, and it means you need to track not just individual users, but also the value of each product you sell. Customer lifetime value is a chart of the total value of each individual customer, whether they've made a single purchase, an ongoing subscription, or several purchases over time. It's one of the most important key financial performance indicators.
Lifetime Value Per Channel. This is a division of lifetime value split up by marketing channel. What channel did the user use when they arrived on your site? Was it from your blog, or from your social media, or from a referral, or from an affiliate, or from a paid ad? This view will show you each of these, and the average lifetime value of customers who purchased via that channel, so you can see which channels have the best profits on average.
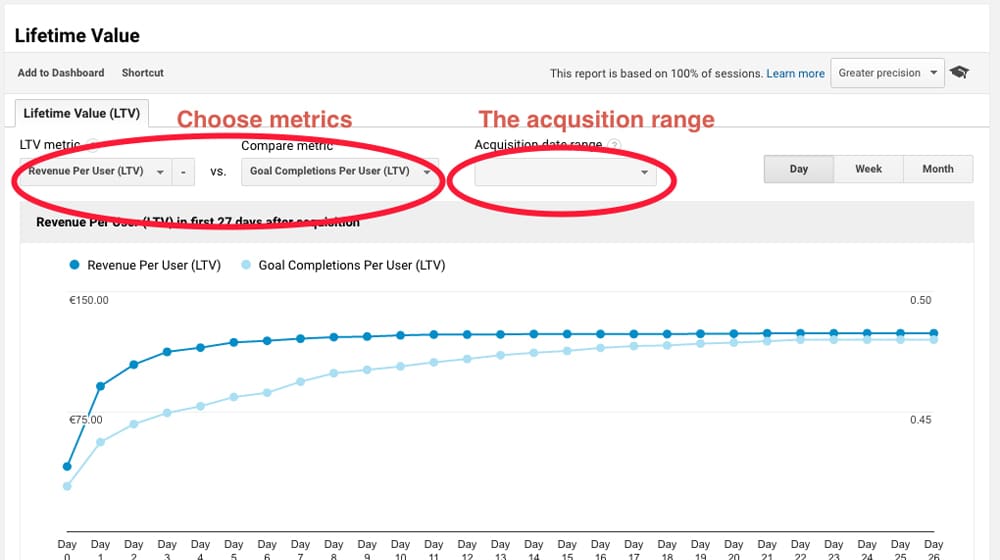
You can then compare this to the cost of using that channel to calculate your return on investment for that channel. This is important because sometimes a channel with lower average customer value is still more profitable because of the significantly lower cost of doing business via that channel.
Conversion Rate Per Channel. Being able to see what the conversion rates are for each given marketing channel is also important. If one has a very low rate, is it because of something inherent with the channel - like how display ads are pretty poor quality these days - or is there something your site is doing wrong, and thus room for improvement?
There are all kinds of derived reports like this. Splitting up data by channel, by content group, by referral source, by demographic information; there's a ton of different ways to look at your data, look for roadblocks that are keeping some subsets of your users from converting, and eliminate those roadblocks.
Above, I mentioned that you can also download report templates and use them in your own analytics to get you custom views. Neil Patel has a huge article written about these reports, which you can find here. They include reports like:
- Internet browser metrics. This can show you things like how many of your users are using one browser or another; for example, if some browsers get much higher or lower bounce rates, or have a lower time on site, you may have a browser-specific bug. It will show other usage metrics as well for an overall picture of how well your site is performing on each browser.
- Behavior reports. An award-winning user behavior report shows you the difference between new and returning users and their behavior on your site.
- Time reports. Seeing what hours of the day and what days of the week are your peak hours allows you to do everything from properly time your marketing efforts, to prepare for potential spikes of traffic during viral surges or holidays.
There is a lot there, and they can inspire you to make your own reports as well. The fact is, Google harvests a ton of data you can use, and it all comes down to figuring out how to use it for yourself.
Step 4: Optimize for Sales
The premise of this post is on how to track sales through your blog, and that's one of the easiest things to do with Google Analytics. As long as you properly define your goals and have the right level of rich data set up to assign prices and other metrics, you can get a ton of useful information. So how do you use that information?
Look for underperformance. With granular reporting, you can look for particular kinds of content groups, or landing pages, or marketing channels, which have relatively poor performance. When you identify the low performing sections of your site, you can figure out why. Do your users just not like infographics? Do your blog posts turn them off? Are they simply not progressing through your landing pages? Examining the weak points in your marketing allows you to optimize for more, better conversions.
Look for high performance. Conversely, you can look for the high performing content groups, channels, and referrers. Knowing where your good traffic and good conversions come from allows you to examine what's working, figure out why it's working when other channels are not, and change the underperforming channels to work better. You can also examine just your high converting audience, to see if there are some key demographics that they don't share with the rest of your audience.
Look for high cost-for-performance. Some channels cost more to use than others. Writing a blog post is a lot cheaper than paying for an infographic, which is cheaper than producing a video, but if that infographic gets way more performance than the video, it's a better investment. Calculating ROI is part of this, but you want to get the whole story.
Look for roadblocks in the conversion process. By examining the user journey from the time they reach your site to the time they leave, you can look for particular stopping points. Why did a given user not complete a purchase? Were they turned off after visiting your pricing page, or after reading your features list (and not finding what they wanted), or what? Figure out which page your visitors are stopping at and look for things like website bugs or information disparity, or any other issues that may be leading to shorter-than-average visitor sessions. If you notice certain pages consistently underperforming in search as well, it may be worth exploring why your key pages aren't ranking on Google.
All of this and more can be done with Google Analytics, you just need to have it all set up and tracking data first. So get to it!
Written by James Parsons
Hi, I'm James Parsons! I founded Content Powered, a content marketing agency where I partner with businesses to help them grow through strategic content. With nearly twenty years of SEO and content marketing experience, I've had the joy of helping companies connect with their audiences in meaningful ways. I started my journey by building and growing several successful eCommerce companies solely through content marketing, and I love to share what I've learned along the way. You'll find my thoughts and insights in publications like Search Engine Watch, Search Engine Journal, Forbes, Entrepreneur, and Inc, among others. I've been fortunate to work with wonderful clients ranging from growing businesses to Fortune 500 companies like eBay and Expedia, and helping them shape their content strategies. My focus is on creating optimized content that resonates and converts. I'd love to connect – the best way to contact me is by scheduling a call or by email.


October 08, 2020
As a wannabe blogger this is exactly what I needed... Google Analytics is a bit less intimidating now.
October 12, 2020
Hey Shayur!
Happy to help - I've been using Google Analytics for years and only recently started using Goals.
I don't know why, but I always ignored that section. Once you start using it it's so valuable, especially when you start blogging (so you know which of your blog posts are resulting in the most goal conversions). Very powerful stuff!
October 17, 2022
I was the same! I had no idea setting up Goals would be this useful.
January 11, 2021
Web Analytics platforms such as Google Analytics provide a hugely valuable service for all website owners, especially bloggers. The ability to dig into the performance of one's content, as you explain throughout this post, is the ability to improve it. It's good to see Content Marketers (such as yourself) helping others achieve similar successes with these tools.
January 14, 2021
Hey Bret!
Kudos, I agree completely. Before Google Analytics we were blind, and now we can see!
Thansk for stopping by.
February 03, 2021
Good stuff in here. I just want to ask, when can you say that the channel is underperforming? Should I wait 3 consecutive months to prove that a certain channel is underperforming so I can replace them or 1 month is better?
February 03, 2021
Hey Dennis!
It depends on your KPI for your blog and the cost of that channel.
For example, if your organic performance is a bit lackluster, I wouldn't drop your organic strategy completely.
It could be your bounce rate is high because your pages have poor user experience, or your mobile design is difficult or frustrating to use.
Underperformance is something that should be investigated to determine the cause.
With social media, a high bounce rate and low time-on-site are to be expected - people move through their feeds pretty quickly and have a short attention span. However, it may not cost you very much (or it may be free) to get those visitors, so they might not be worth ignoring or getting rid of either.
Getting visitors to your site is difficult, which is why most people focus on that obstacle. An equal amount of importance should be put on your site's user experience and engagement. Looking at Google Analytics can help you spot areas for improvement, like pages with a high bounce rate or low time on site.
August 17, 2022
Great response!
August 22, 2022
Thanks Paul!