The Basics: MTD, QTD, YTD, MoM & YoY Reporting
Written by ![]()

Any time you're doing, well, much of anything that has goals you want to meet, you have to know how to track your progress toward those goals.
Ostensibly, this is pretty easy. You know where you are, you know what the goal is, so it should be pretty easy to see how far along the path you've made it. But there's one thing missing from this equation:
Time.
Time is the great boundary that affects everyone equally and can make the difference between success and failure.
Say you want to grow your business to the point where you're making a million dollars a year in revenue. It's a fairly lofty goal for many, but it's certainly achievable with enough effort, elbow grease, and a dash or two of luck. Now, say you've made it to the point where you're bringing in $250,000 per year in revenue. You're a quarter of the way there!
But how good is that, really? You need to put it into perspective through the lens of time.
If you've grown your business to the point of making a quarter-million per year in the space of two years since you were founded, that's extremely impressive. On the other hand, if it's taken you 20 years to reach that point, it indicates you have much, much further to go. Time is the great equalizer.
Now, if you read the title and saw the big string of acronyms and then read this intro, you've probably put two and two together to recognize that they're all different time-bound kinds of reporting.
So, let's dig into them, what they mean, and how they're useful.
Key Takeaways
- MTD, QTD, and YTD are "to-date" reports tracking current period performance, while MoM and YoY compare completed periods retrospectively.
- Time-bound reporting only works with SMART goals - metrics must be specific, measurable, achievable, relevant, and time-bound.
- MTD reporting offers granular short-term insights but can miss broader trends and never captures a complete month's performance.
- Companies may use fiscal quarters instead of standard ones to better align reporting with seasonal peaks or operational cycles.
- YoY reports suit high-level business performance and growth trends, while MoM reports better support ground-level decision-making.
SEO, SEM, PPC: What to Track?
Before we get into the actual types of reporting, let's talk for a moment about what you're actually tracking. Do any of these kinds of reports have limitations, definitions, or restrictions on what they can and can't track?
Not really.
All of the definitions I'll go into below are just lengths and types of time tracking. All of them require some kind of metric to be tracked over that time, but it truthfully doesn't matter which metric that is. It can be website visitors, newsletter conversions, or profits from paid ads. The only requirement is that it be tangible.
What you want is a SMART goal. SMART, of course, is another acronym.
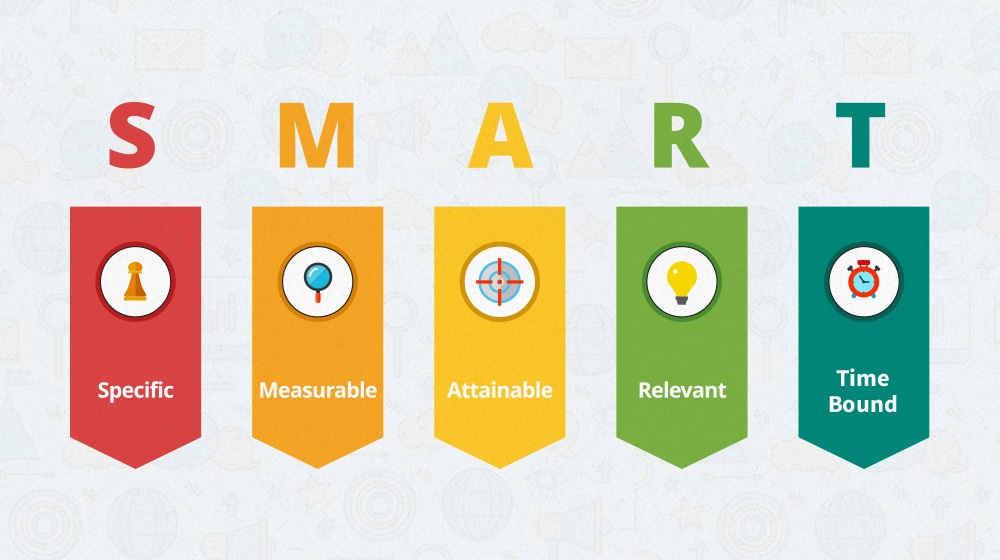
I've gone over this in more detail in my post about setting realistic goals for your blog, but to briefly cover it here:
- S is Specific, meaning your goal needs to track a granular metric like the number of visitors, not something nebulous like "business growth."
- M is Measurable, meaning it needs to be something you can actually measure. Money in or new visitors are trackable; "awareness" is not.
- A is Achievable, meaning your goal needs to be something you can reasonably hope to achieve. Having dreams of being #1 on the Fortune 500 isn't really attainable for most businesses.
- R is Relevant, meaning your goal is actually useful and important to your business. "Spending more time with the family" doesn't help business growth and isn't a trackable business goal, even if it's laudable.
- T is Time-bound, which is where we get into the definitions I'll go through.
All of this is basically just to say that whatever you choose to track, in addition to being something you can track changes in over time and with specificity, needs to be tangible and important to your business.
So, whether you're tracking new visits to your blog from organic sources to measure SEO, engagement over time on social media posts for SMM, revenue generated by advertising through Google Ads for PPC, or something else entirely, it all can be measured over time, and can all be relevant to the definitions of time-bound reporting.
So, let's get into those definitions!
MTD Reporting
A month-to-date report is a report generated on short-term information, and it's most relevant for short-term campaigns or events. For example, you can view a short-term report from the past and compare it to the current month-to-date, tracking changes you made on the first of the month and how those changes impact your overall metrics. This could be changes ranging from retroactively adding keywords to blog posts to optimizing your keywords or ad copy in your paid ads to pushing a new ad campaign centered around a holiday or event that took place earlier in the month.
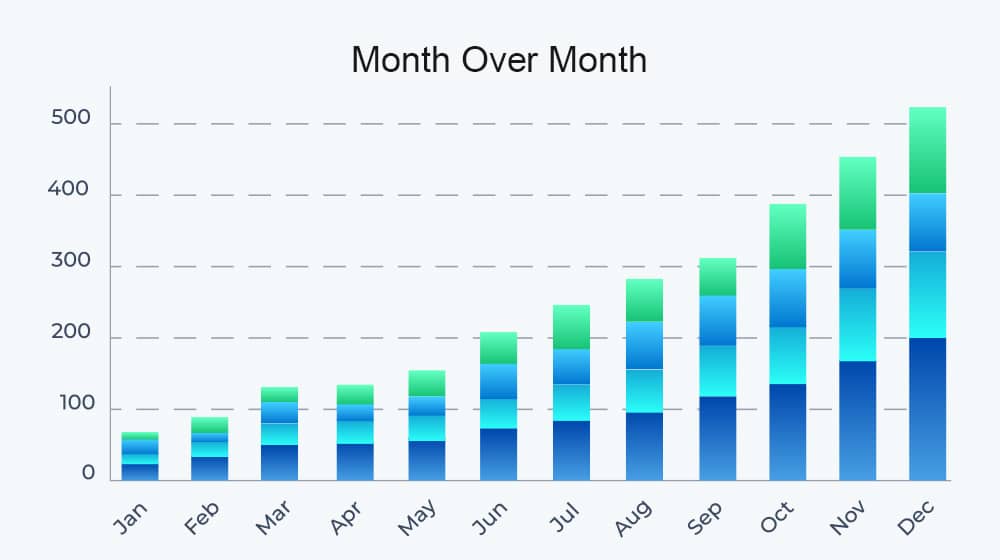
Monthly trends are also visible on MTD reporting when they might be washed away on longer-term reporting. Sampling data on a daily basis for monthly reports gives you smaller-scale breakdowns compared to sampling weekly or even monthly data for even longer-term reports.
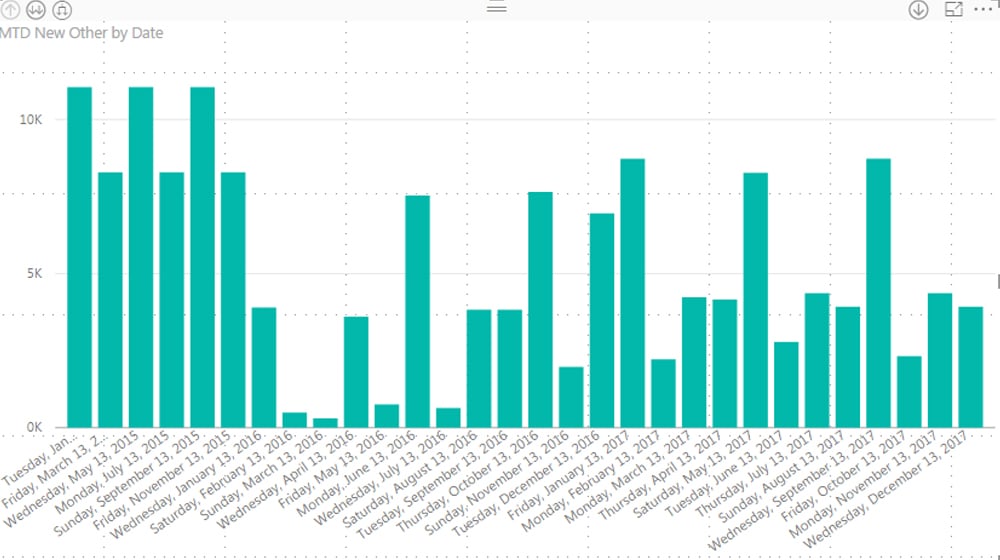
Image source: https://community.fabric.microsoft.com/t5/image/serverpage/image-id/32864i34B3E6F71389F592/image-size/large?v=v2&px=999
There are some drawbacks to MTD reporting.
- Since it's always to date, you never get a complete picture of a month's performance.
- As a result, if you have a business that traditionally does best at the end of the month, MTD reporting can look like you aren't doing as well as you normally do because the best is yet to come.
- The higher level of granularity with month-to-date reporting can also mean you get lost in the weeds trying to manage or optimize variations that, in the grand scheme of things, don't really matter.
- Since the picture is very "zoomed in" on the current month, you don't get to see how your business is trending overall. Whether you're trending upwards or downwards in a given month may not be reflective of the same trend over the course of the year. A monthly downturn might look huge on MTD reporting but is barely a blip on overall growth when viewed across the year.
In general, month-to-date reporting is best used when you need a close-up, short-term picture of performance, and a monitor of how changes you're making on a weekly or monthly basis are affecting your metrics. Some metrics are great for viewing at this level, while others aren't useful at all. If you use tools like GA4 to track revenue, it's worth verifying your data is being recorded accurately before drawing conclusions from MTD reports.
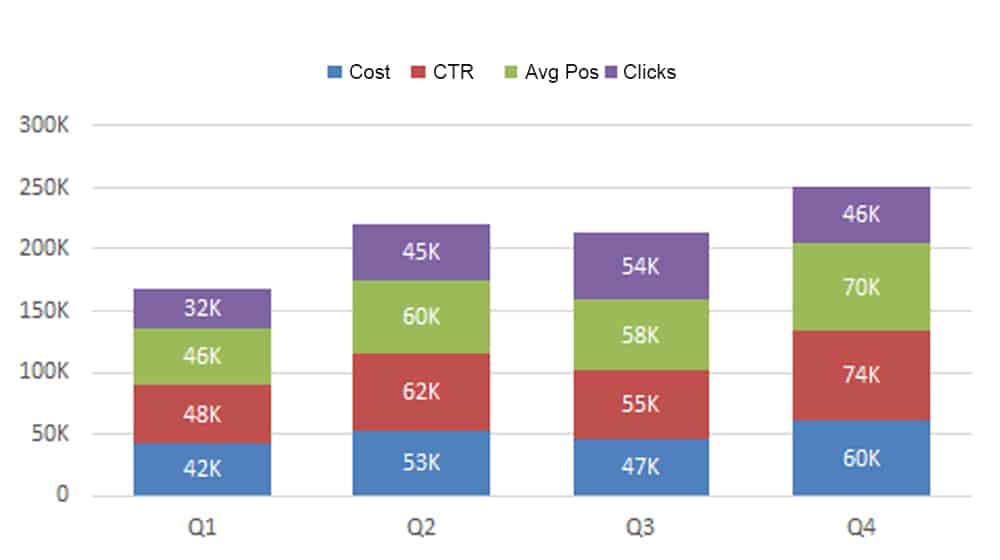
QTD Reporting
A quarter is a three-month period, but there are technically two different kinds of quarters. The standard quarter is the traditional way of breaking up a year into four three-month periods:
- January, February, March
- April, May, June
- July, August, September
- October, November, December
So, to calculate your QTD report, you would identify which quarter you're in, go back to the first day of the first month in that quarter, and gather the metrics from that date to the day before today. This could mean a lot of data if your current date is near the end of the third month, or it could mean very little data if your current date is close to the start of the first month.
What about those other kinds of quarters, though? Well, there's a standard quarter, but there's also a Fiscal Quarter. Fiscal Quarters work the same way by grouping the year up into three-month periods. However, a fiscal quarter can essentially start and end at any time as long as it's a full year long. For example, the US Federal Government's fiscal year starts in October, so October, November, and December are Q1 instead of our usual Q4. Costco set its fiscal year to start in September, so its layout looks like this:
- September, October, November
- December, January, February
- March, April, May
- June, July, August
There are a variety of reasons why a company might choose to set a non-standard fiscal year. For example, maybe you have annual elections for a board of directors that happen in September and take effect in October; you might start your fiscal year when they take office in October. Or maybe you're a heavily seasonal company and want your fiscal year to start or end as you prepare for the lead-up to your peak months.
One of the most common reasons is simple: the holidays are a peak busy season, and ending a fiscal year mid-peak makes reporting a challenge, skews how metrics look, and makes it harder to get a fully seasonal picture. Using fiscal quarters that are slightly shifted allows for better reports.
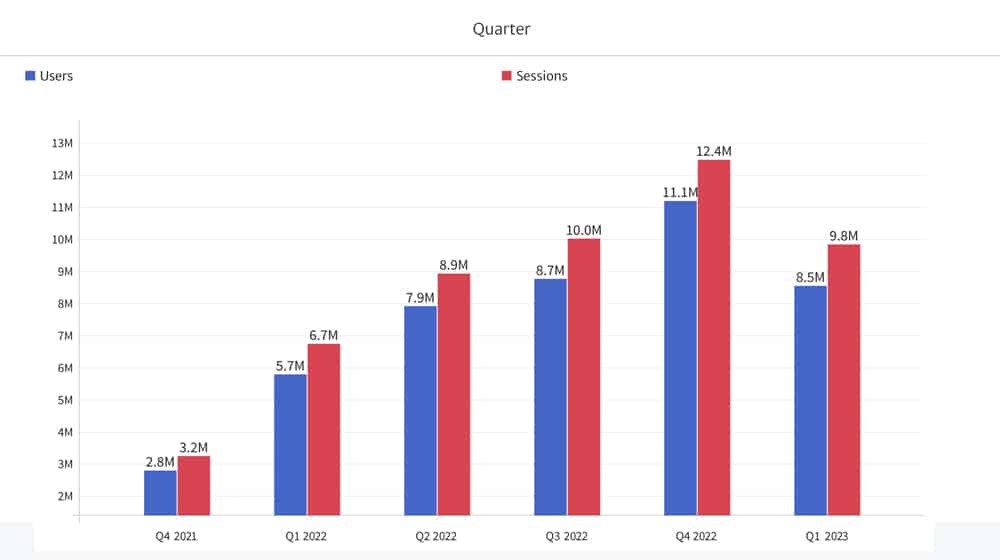
QTD reports are often used for tax planning and business operations. They give you a longer, more representative sample of how your business is doing and can better match up to seasonal divisions for your business.
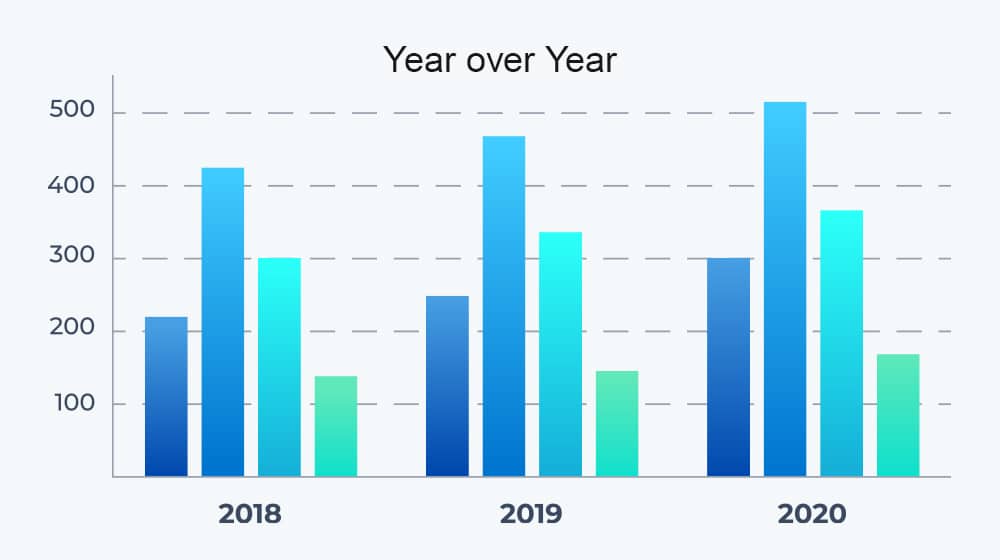
MoM and YoY Reporting
For example, 2023 is just about over now, so in a few weeks, we can all generate our 2023 reports and compare them to our 2022, 2021, and 2020 reports to see how our businesses have progressed over the last year.
Month-over-month works the same way but, again, is zoomed in closer to examine metrics in greater detail. At the start of September, you can generate your August report and compare it to your July, June, and May reports to see how you've been doing month-to-month.
All of these are fairly similar to the to-date reports, except they're slightly more retroactive. Since the period needs to be complete before you can generate the report for comparison, you can't generate it while mid-period like you can with a to-date report.
Year-over-year reports are generally the most common for showing top-level business performance, growth trends, and financial reporting. It's the annual report that you give to shareholders or to your executives to show how the overall direction of the company has fared. Usually, it's also heavily contextualized by what has happened during the year. 2020 reports, for example, all had massive sections dedicated to explaining why the terrible (or excellent, in the case of companies like Zoom) numbers are because of COVID-19 and not because of anything the business did wrong.
Month-over-month reports are more for ground-level decision-making. When you make a change one month, you want to see its immediate impact, and you can see that best by evaluating it in a month-over-month report.
Other Reporting Options
Obviously, as you might imagine, these two frameworks - to-date and post-hoc comparison - can be applied to other time scales as well. You can have week-to-date for very short-term adjustments and year-to-date for very long-term comparisons. You can have week-over-week reporting for short-term records and quarter-over-quarter reporting for a report midway between month and year reports.
All of this circles back around to the main point I made up top: every goal and metric you track is, by necessity, bound by time. Tracking it over time, tracking performance and trends is all a huge part of two things: contextualizing the past and planning for the future. You need to know where you came from to be able to plan where you're going, and you need to know what to expect in the future before you can evaluate the past.
So, now you know how to look at these reports and, more or less, what they're good for. The next step is to go out there and generate them for yourself and evaluate what they mean for you and the future of your business. If you're also looking to expand your reach, there are plenty of free traffic sources to grow your business website worth exploring alongside your reporting efforts.
Do you have any questions about MTD, QTD, YTD, MoM, or YoY reporting? If so, feel free to let me know at any time! I'd be more than happy to help you out however I can.
Written by James Parsons
Hi, I'm James Parsons! I founded Content Powered, a content marketing agency where I partner with businesses to help them grow through strategic content. With nearly twenty years of SEO and content marketing experience, I've had the joy of helping companies connect with their audiences in meaningful ways. I started my journey by building and growing several successful eCommerce companies solely through content marketing, and I love to share what I've learned along the way. You'll find my thoughts and insights in publications like Search Engine Watch, Search Engine Journal, Forbes, Entrepreneur, and Inc, among others. I've been fortunate to work with wonderful clients ranging from growing businesses to Fortune 500 companies like eBay and Expedia, and helping them shape their content strategies. My focus is on creating optimized content that resonates and converts. I'd love to connect – the best way to contact me is by scheduling a call or by email.


September 23, 2024
Thanks for this, this was helpful!
December 30, 2024
Hey Jovonneb, you're very welcome!